BioPortal Solutions
Supporting animal health and welfare.
Create and manage disease data like never before.
Try for freeCharts
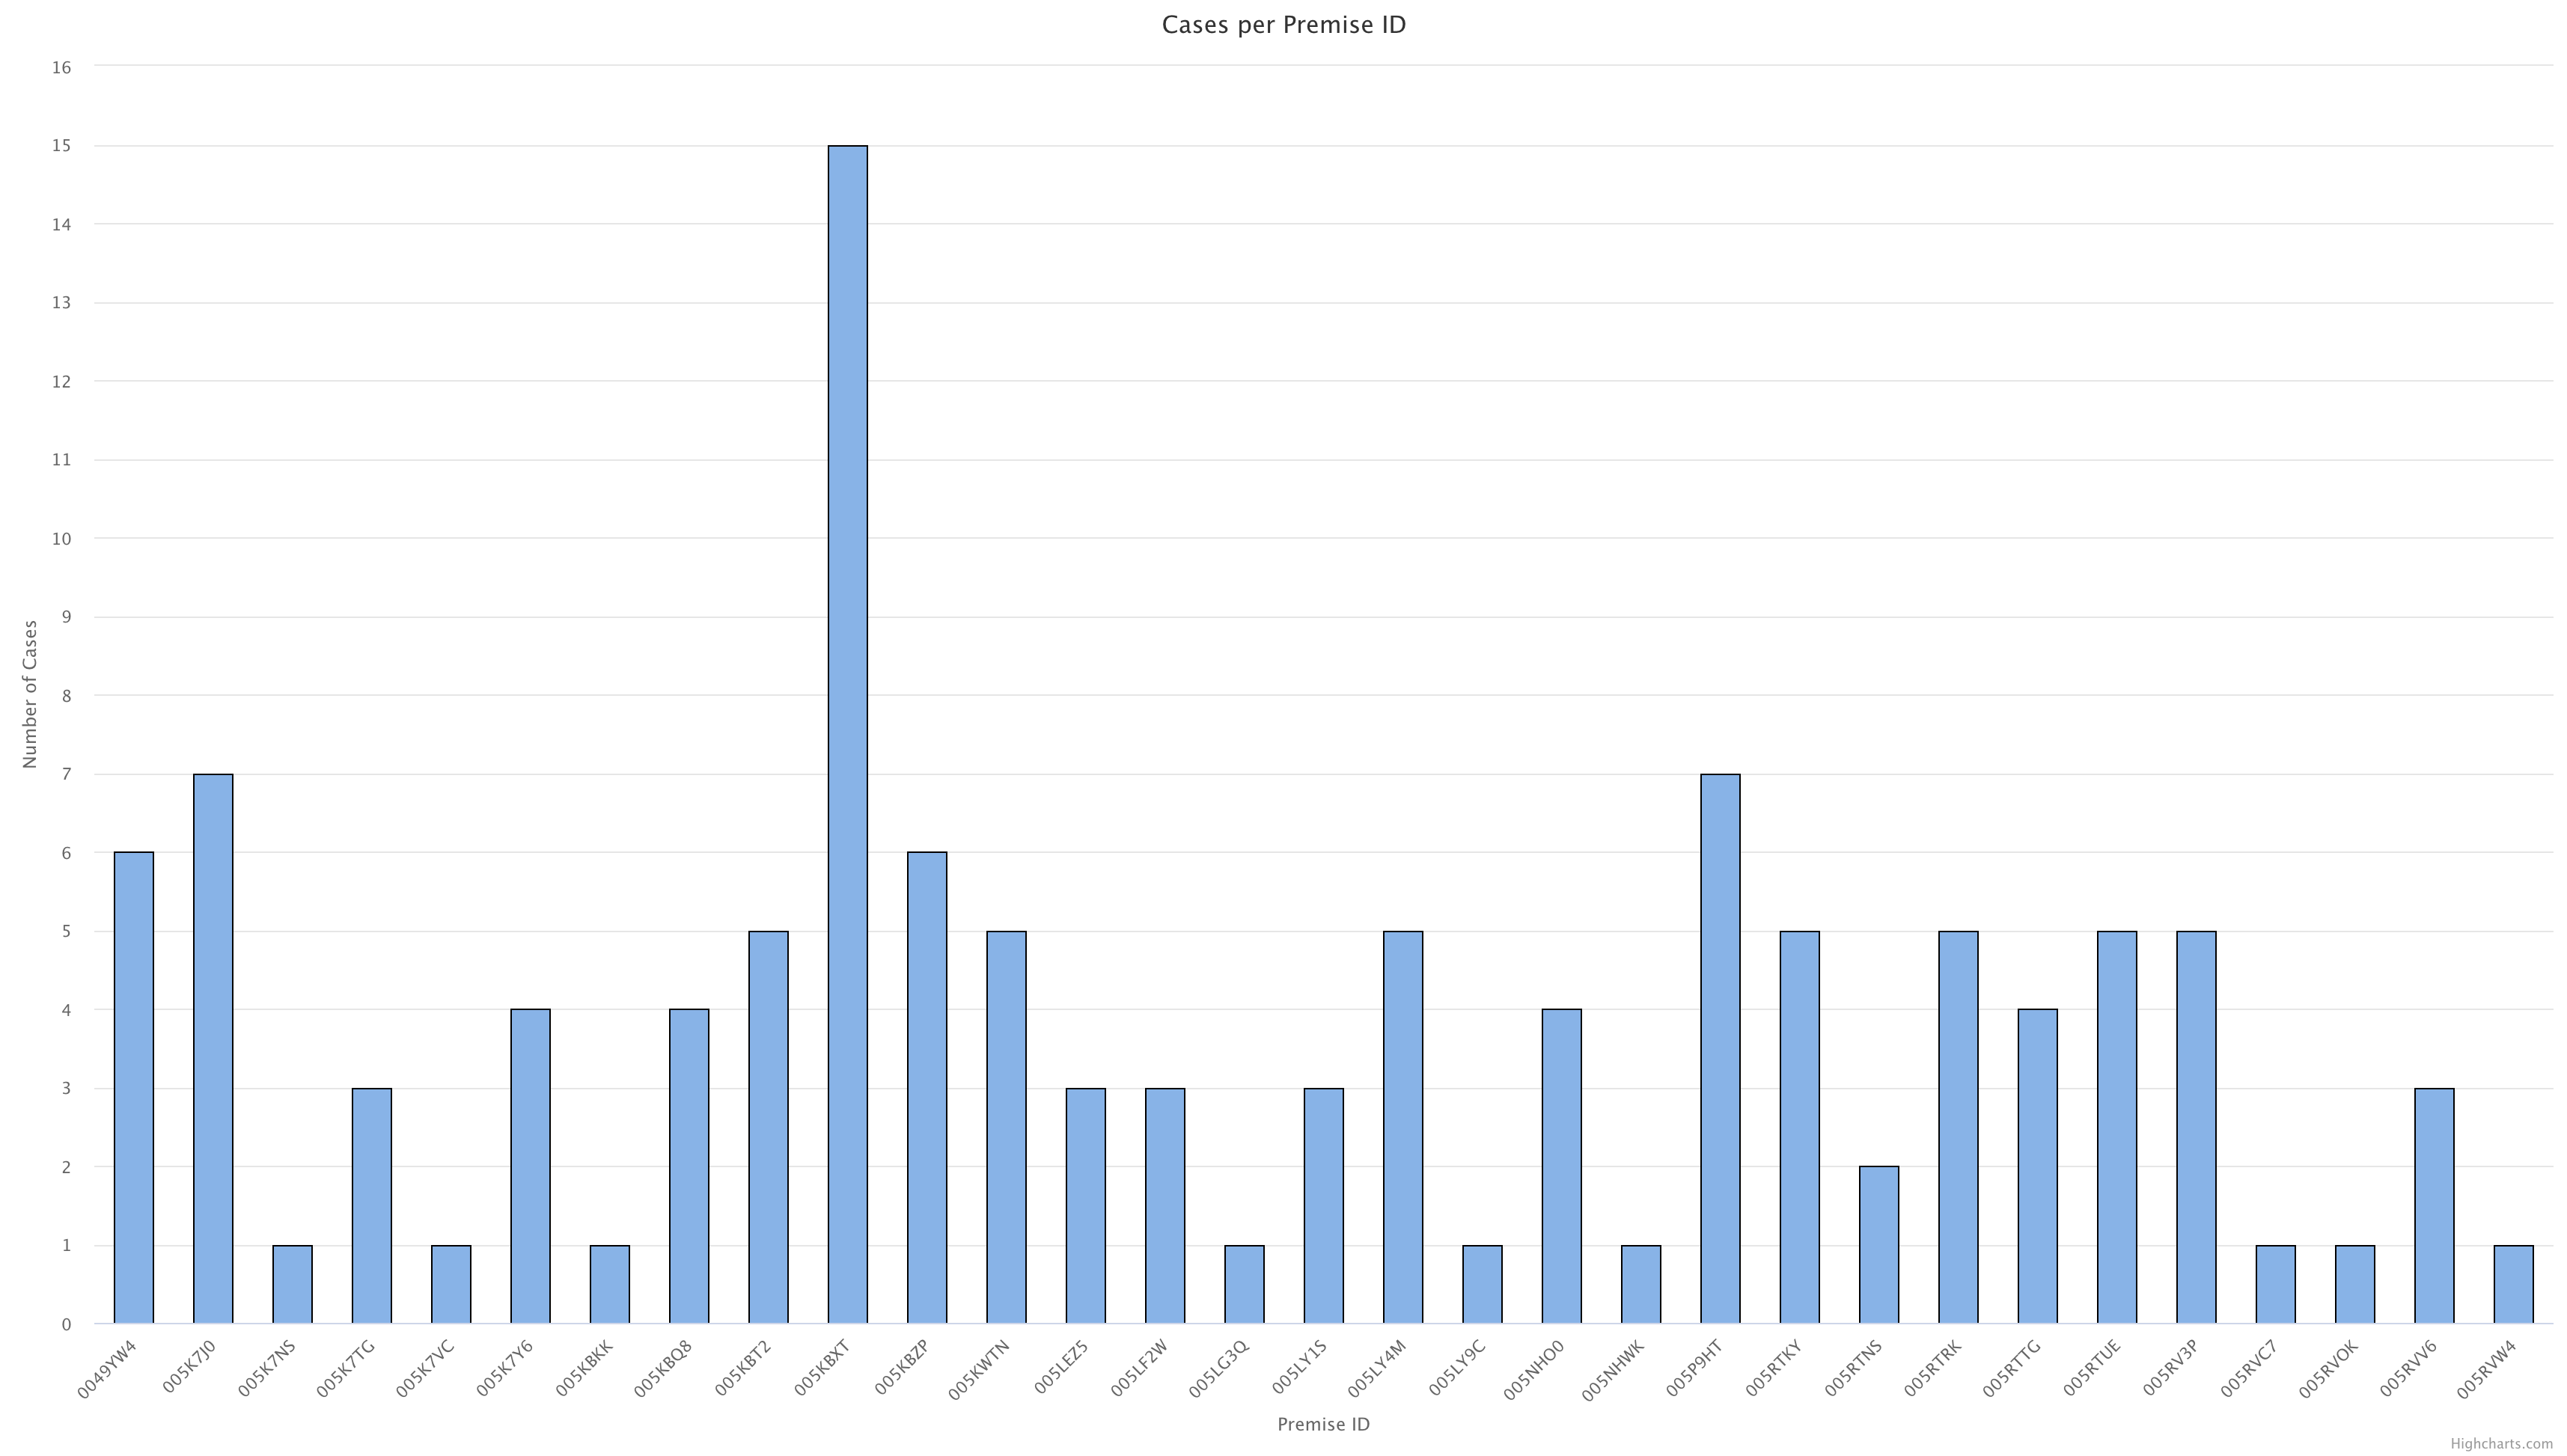
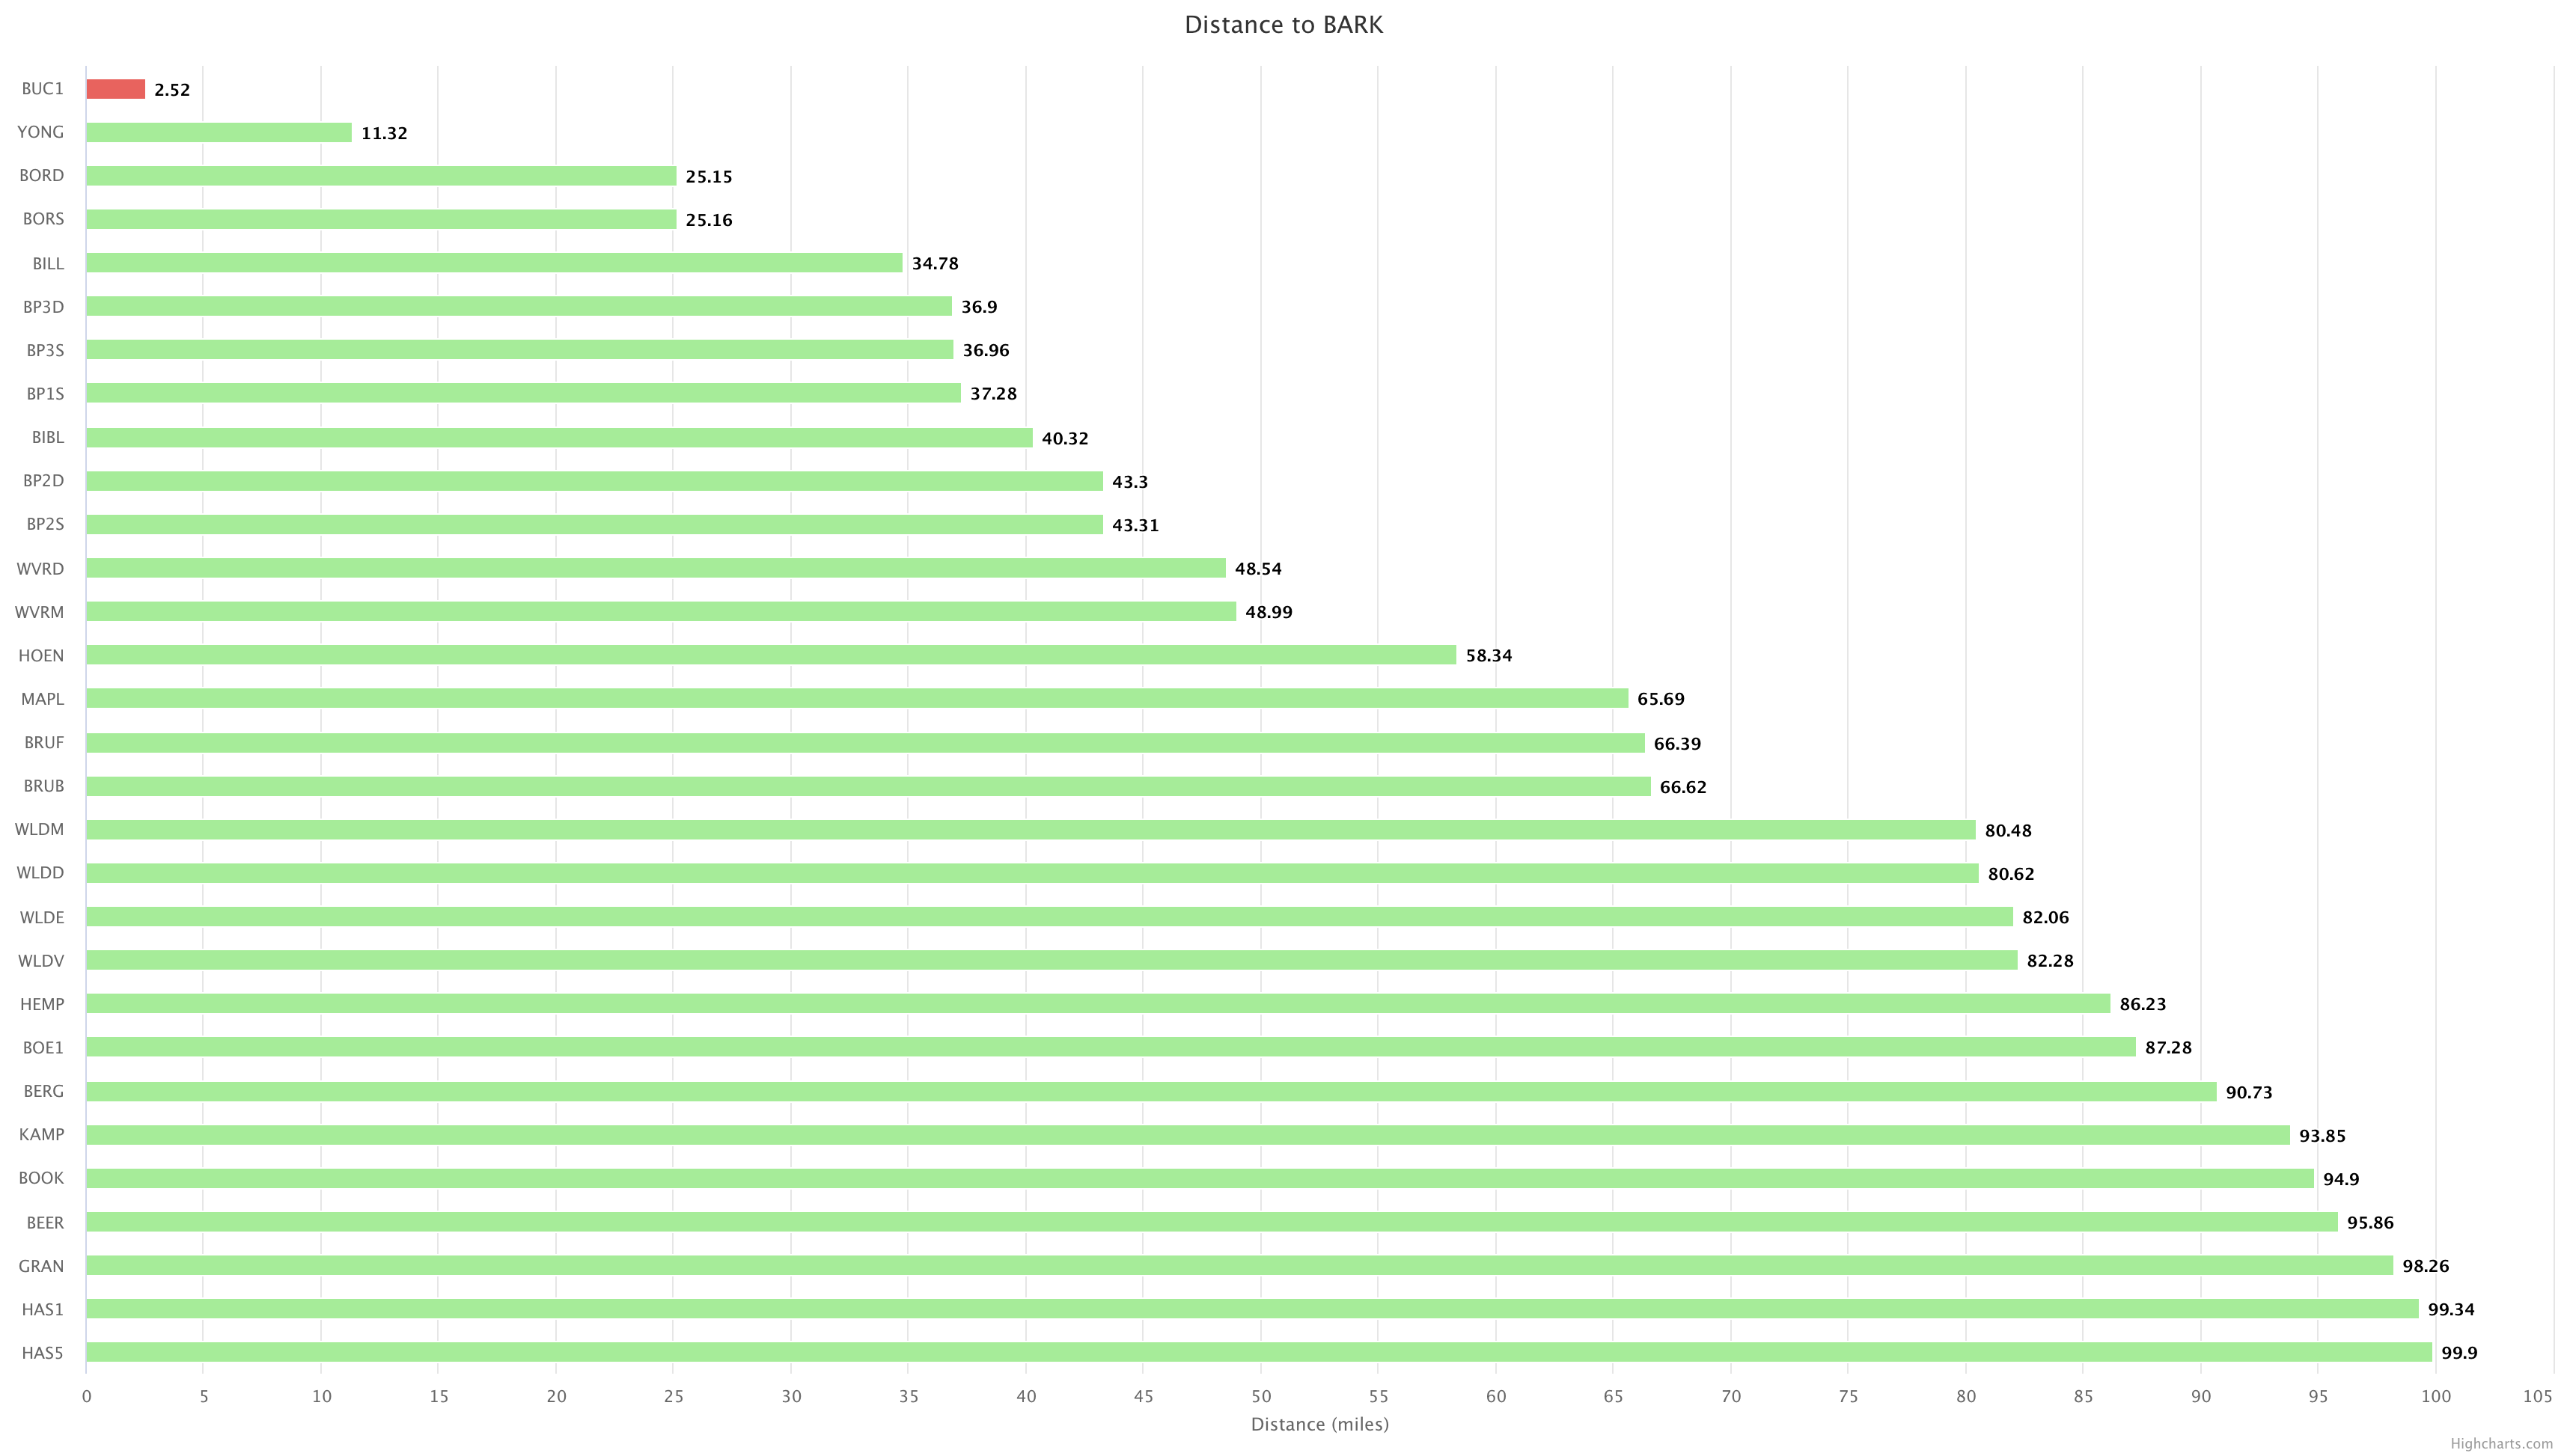
Create epidemic curves, compare sites and evaluate disease patterns. Choose from a variety of graph types.
Basic Chart
Distance Chart
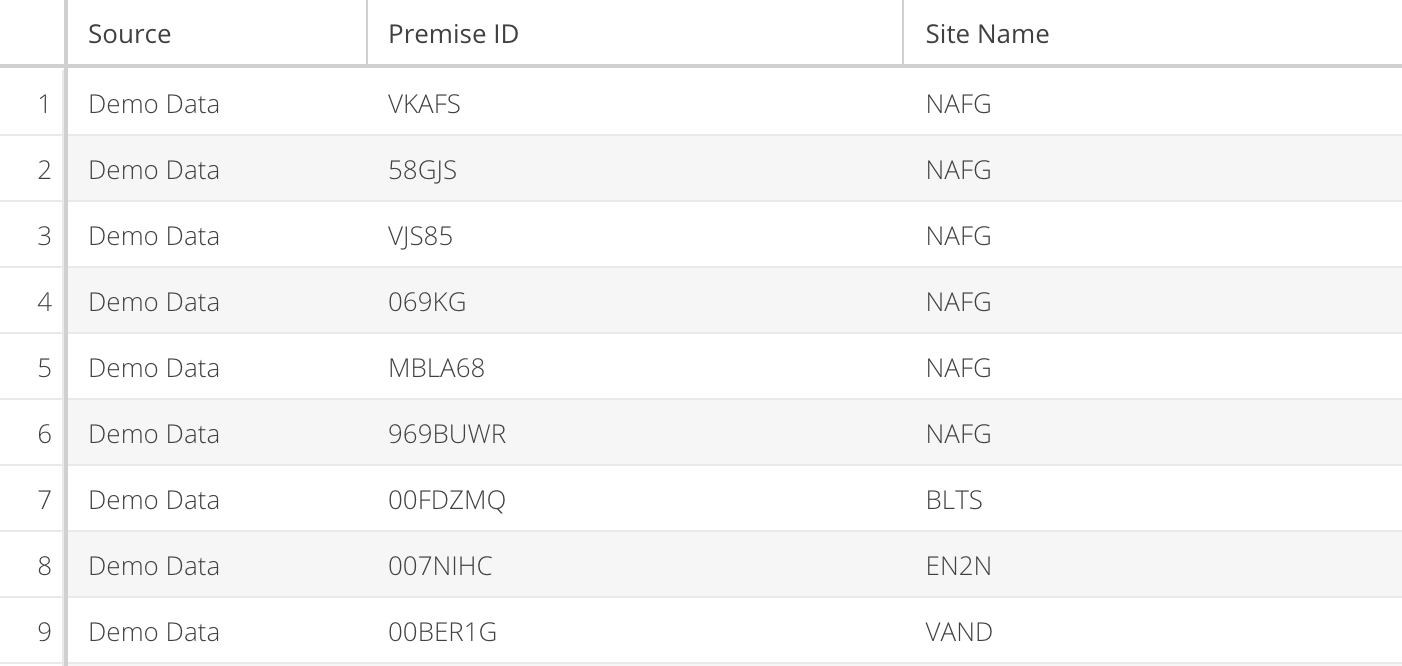
Data Grid
Managing made simple
Visualize and manage the data with ease, even complex data structures.
View data at a glance.
Gene sequencing analysis tools
Phylogenetic Tree
Show phylogenetic changes over space and time.
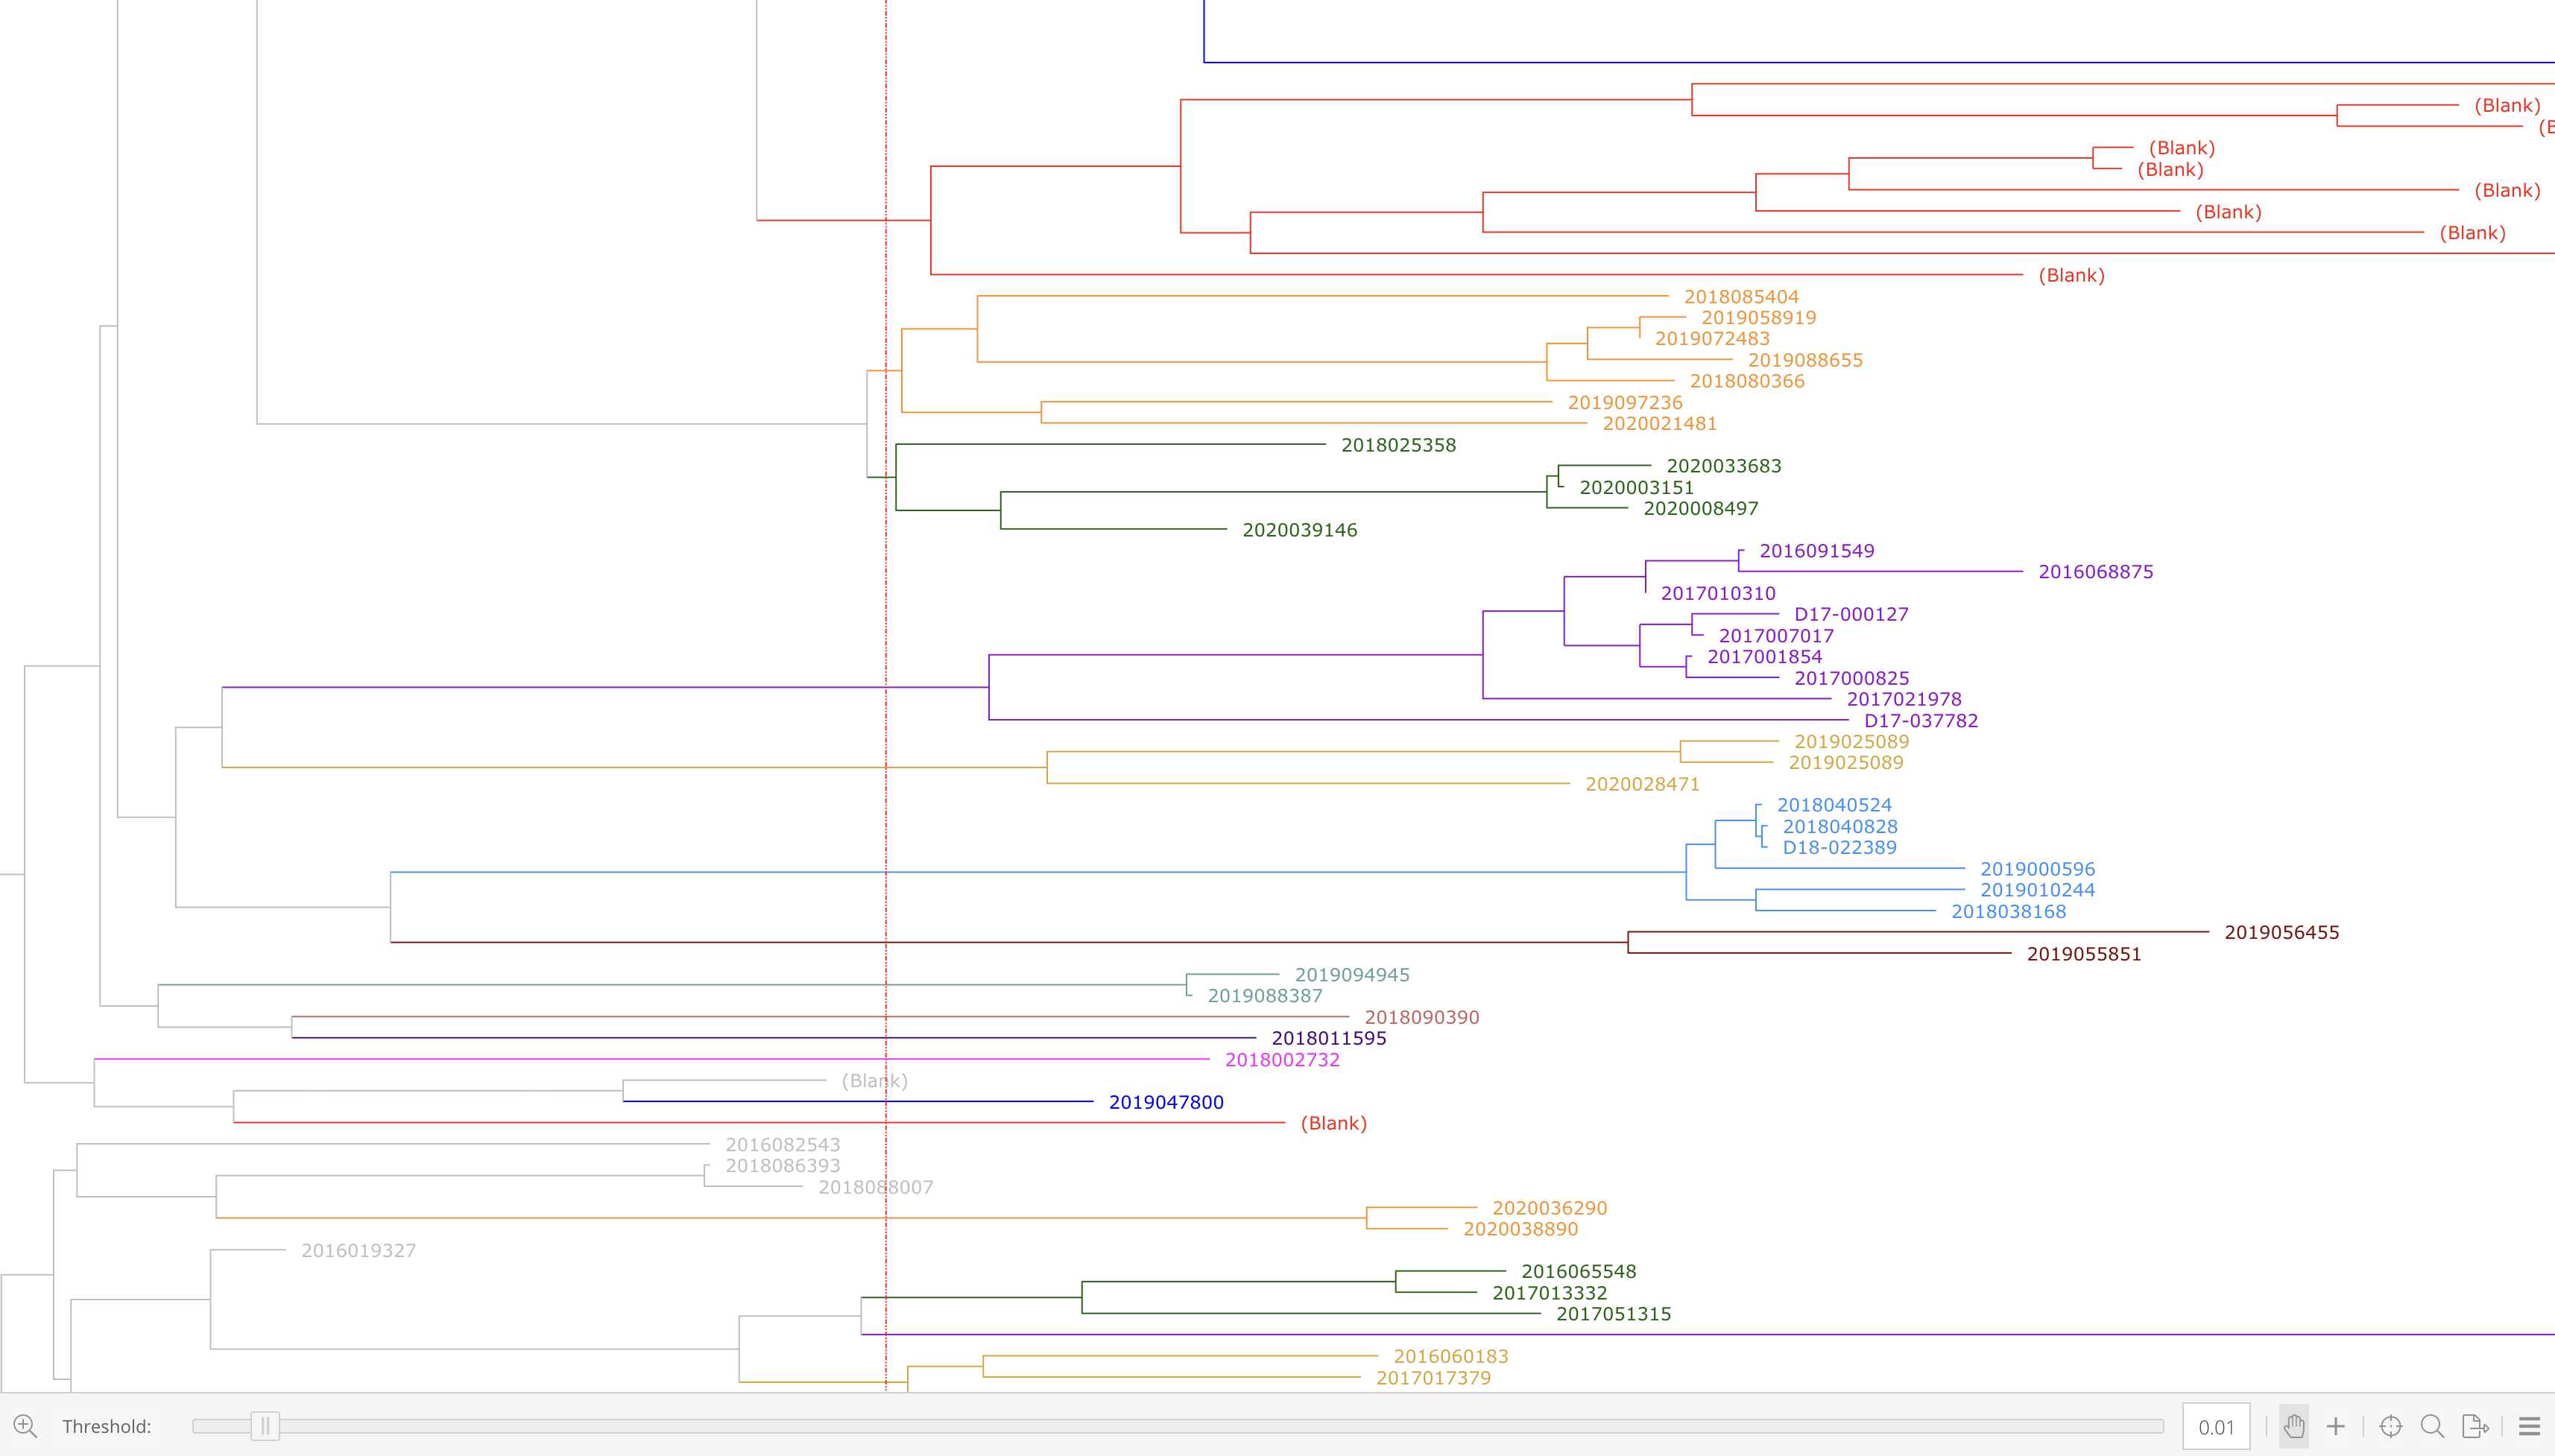
Phylogenetic Chart
Show phylogenetic changes over space and time.
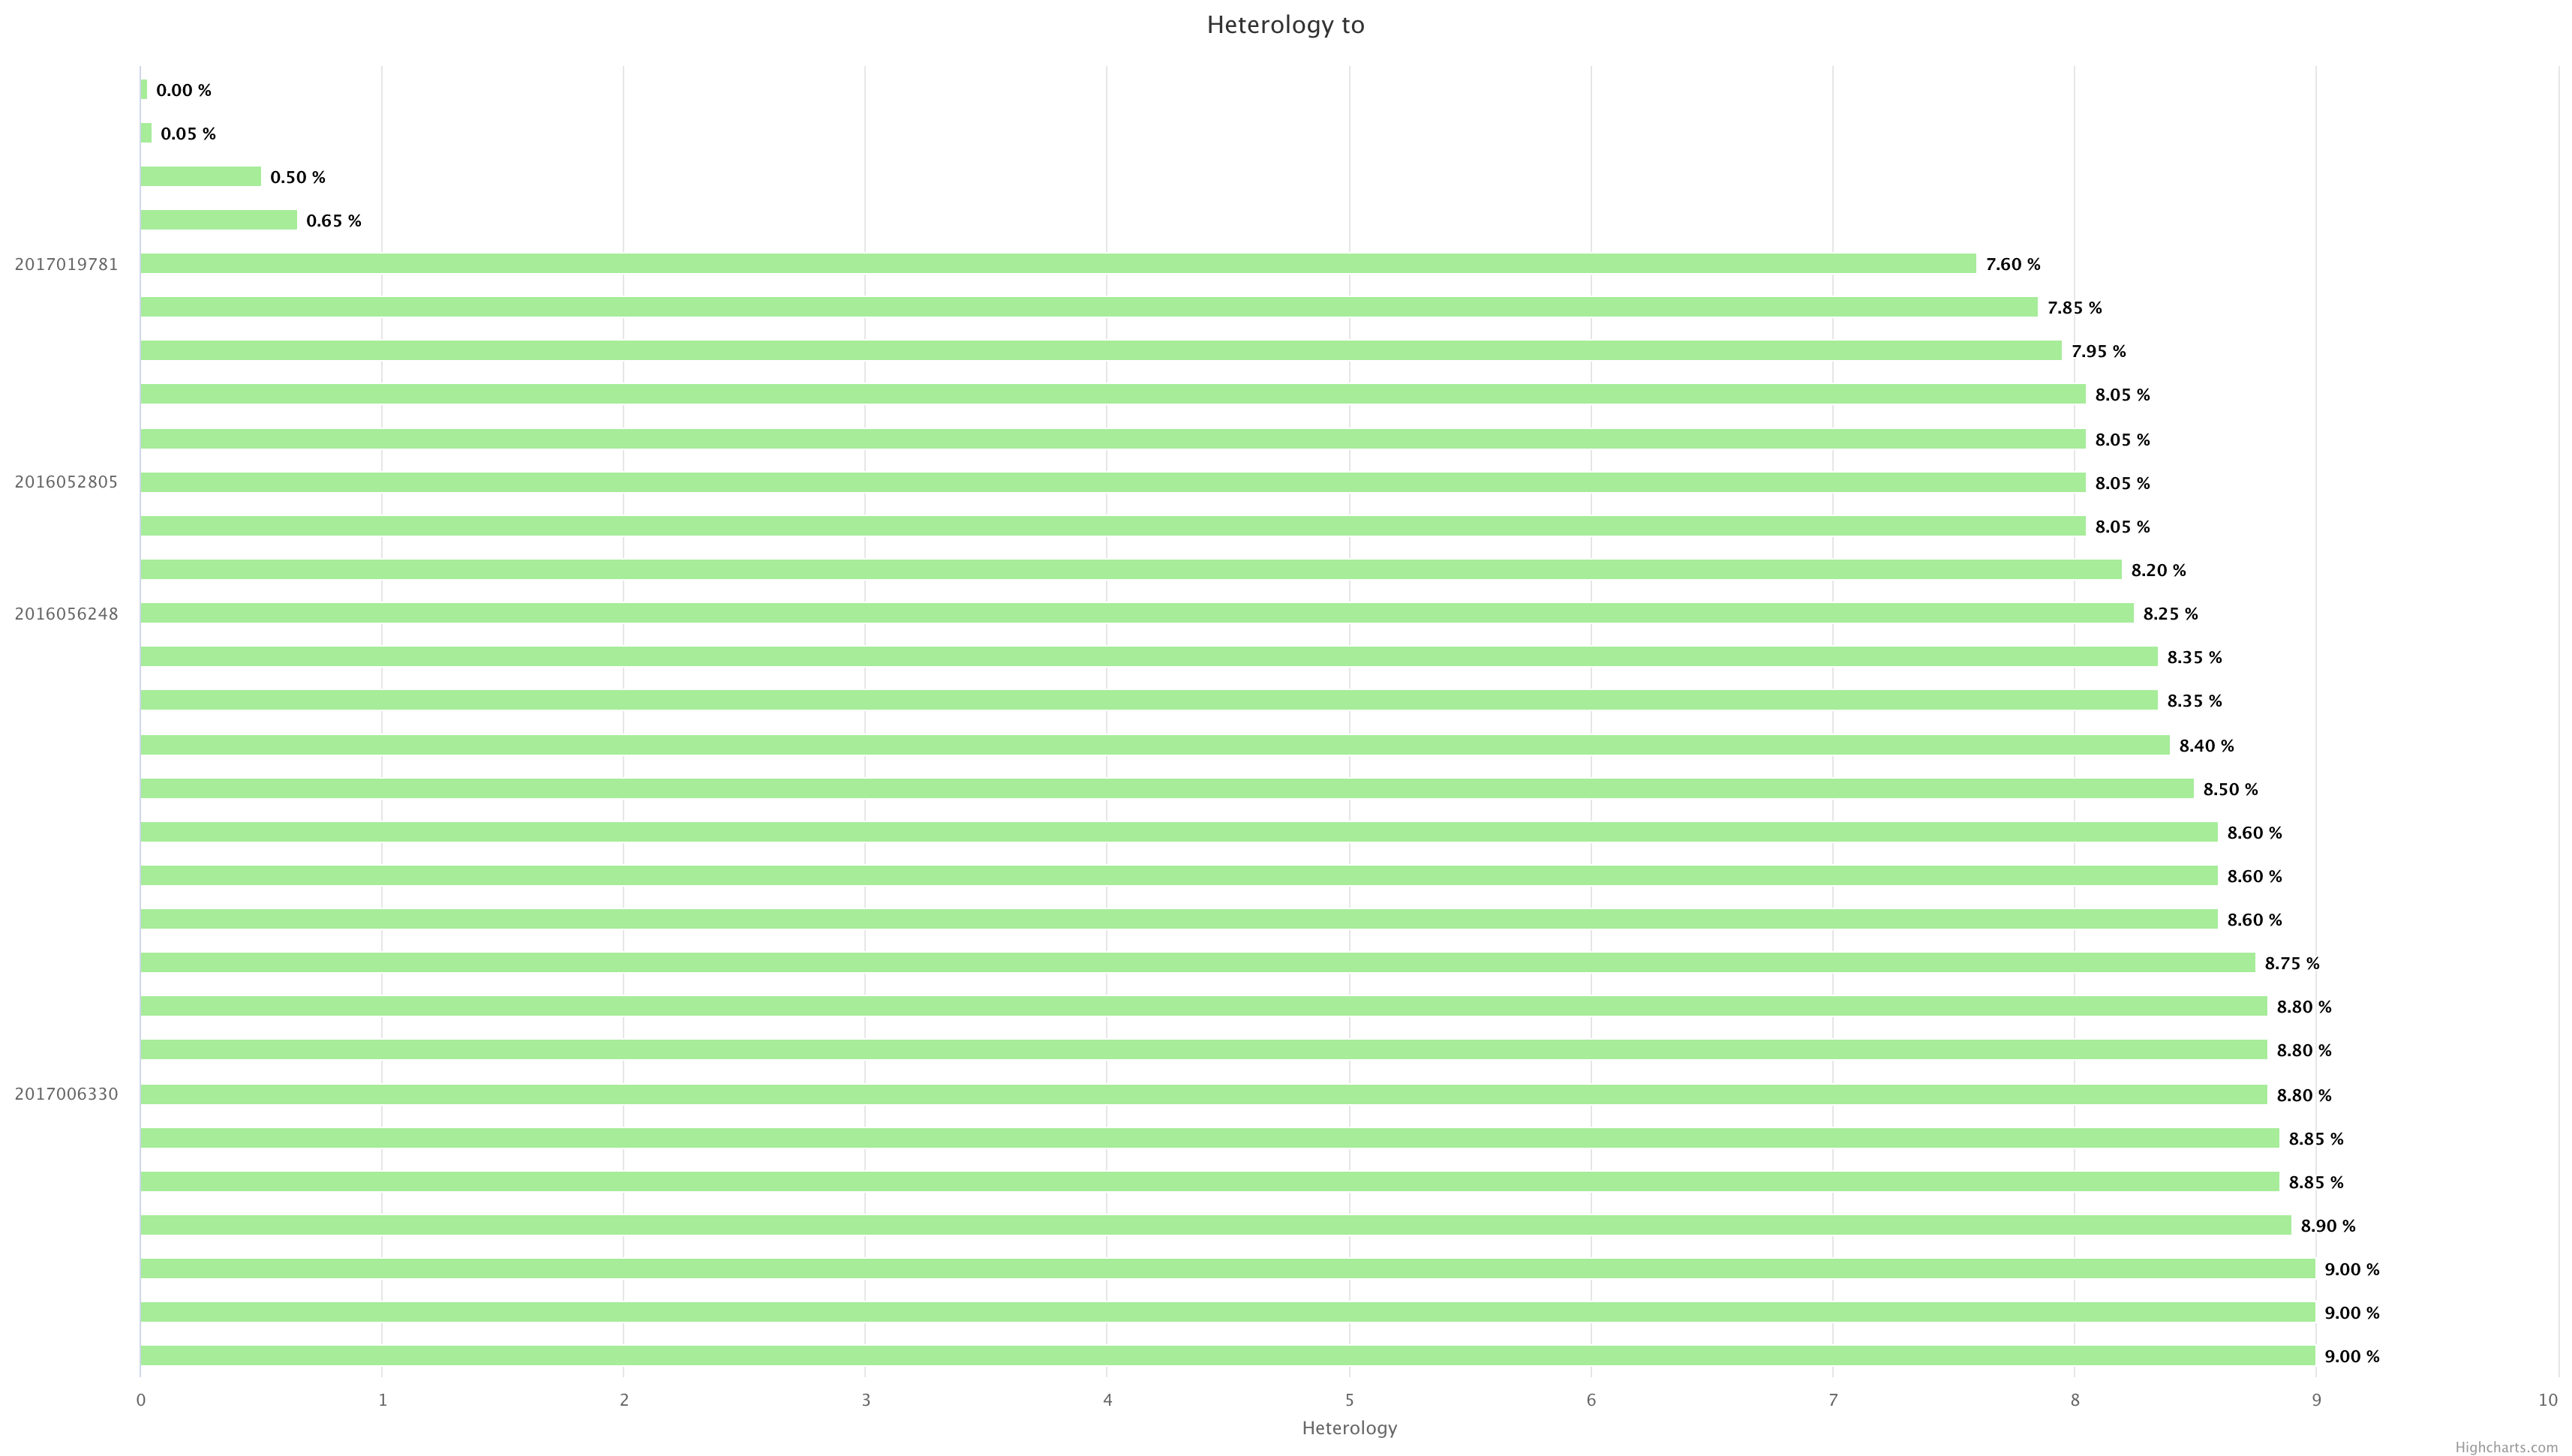
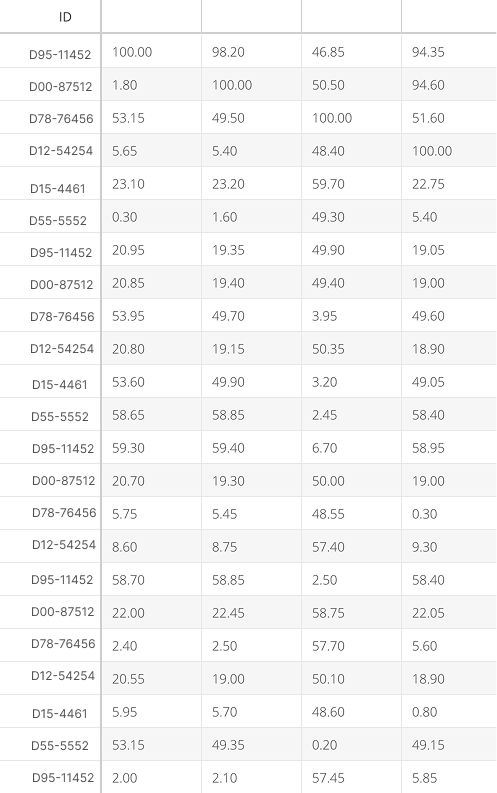
Homology Table
Compare similarities of genes between different disease pathogens
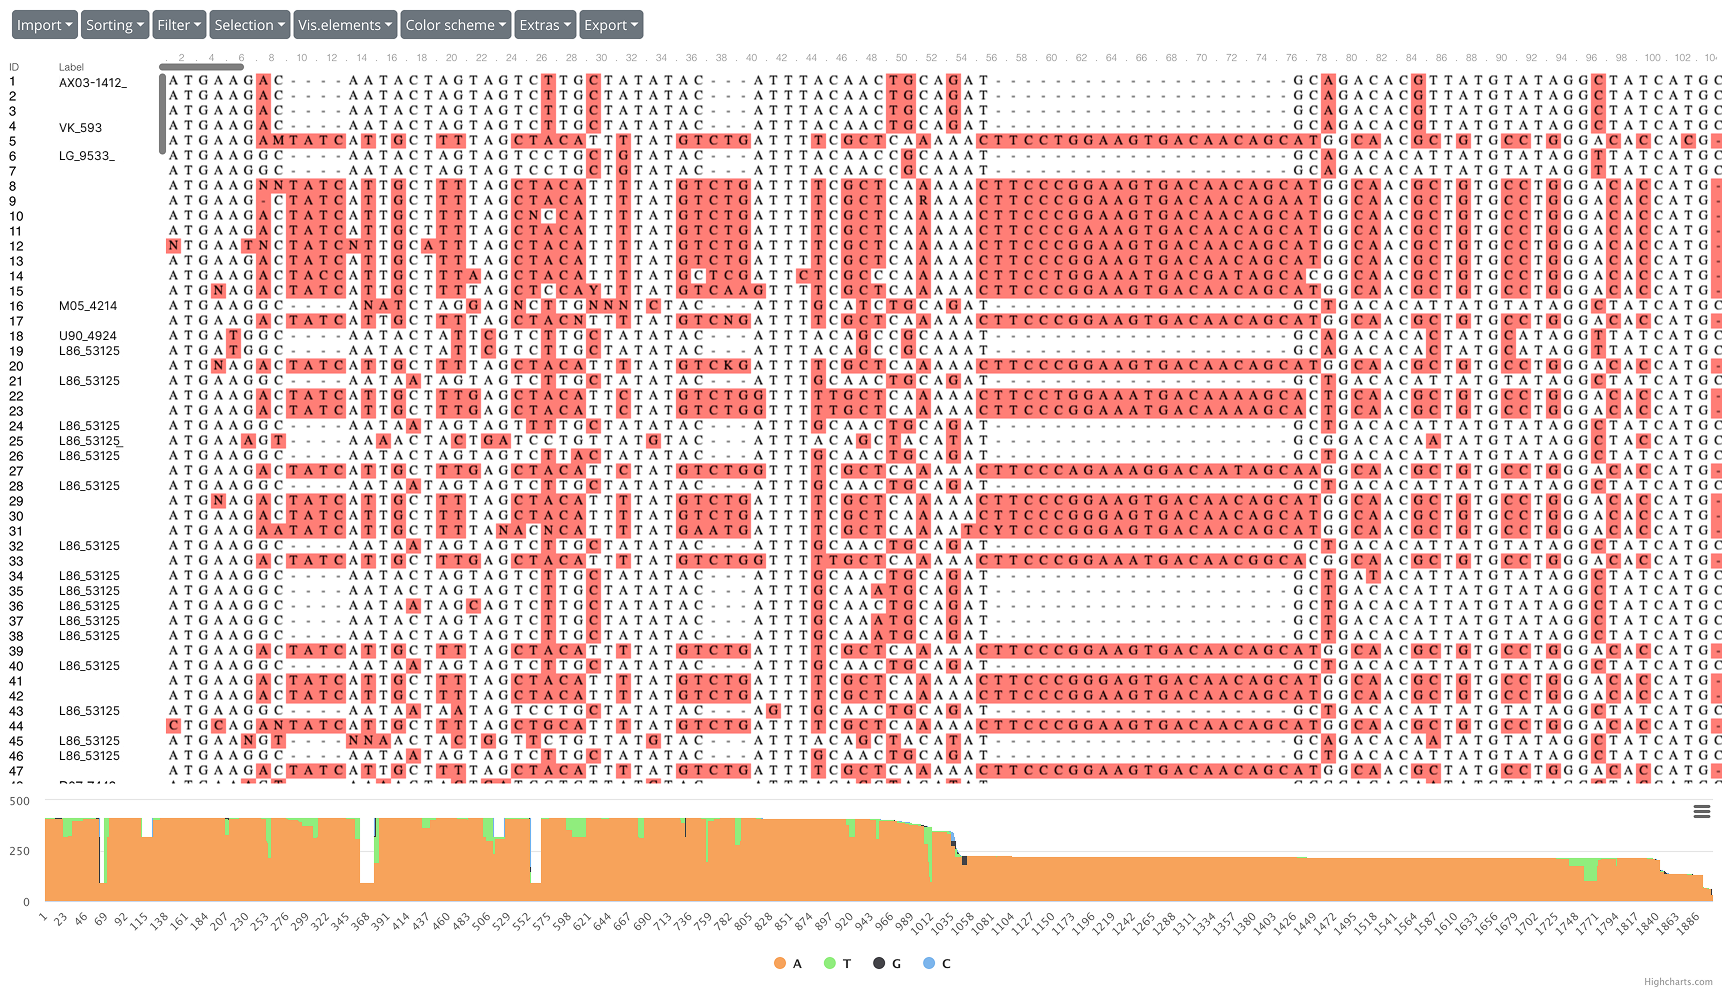
Multi-sequence Alignment Viewer
Identify conserved regions across sequences.
Health Status
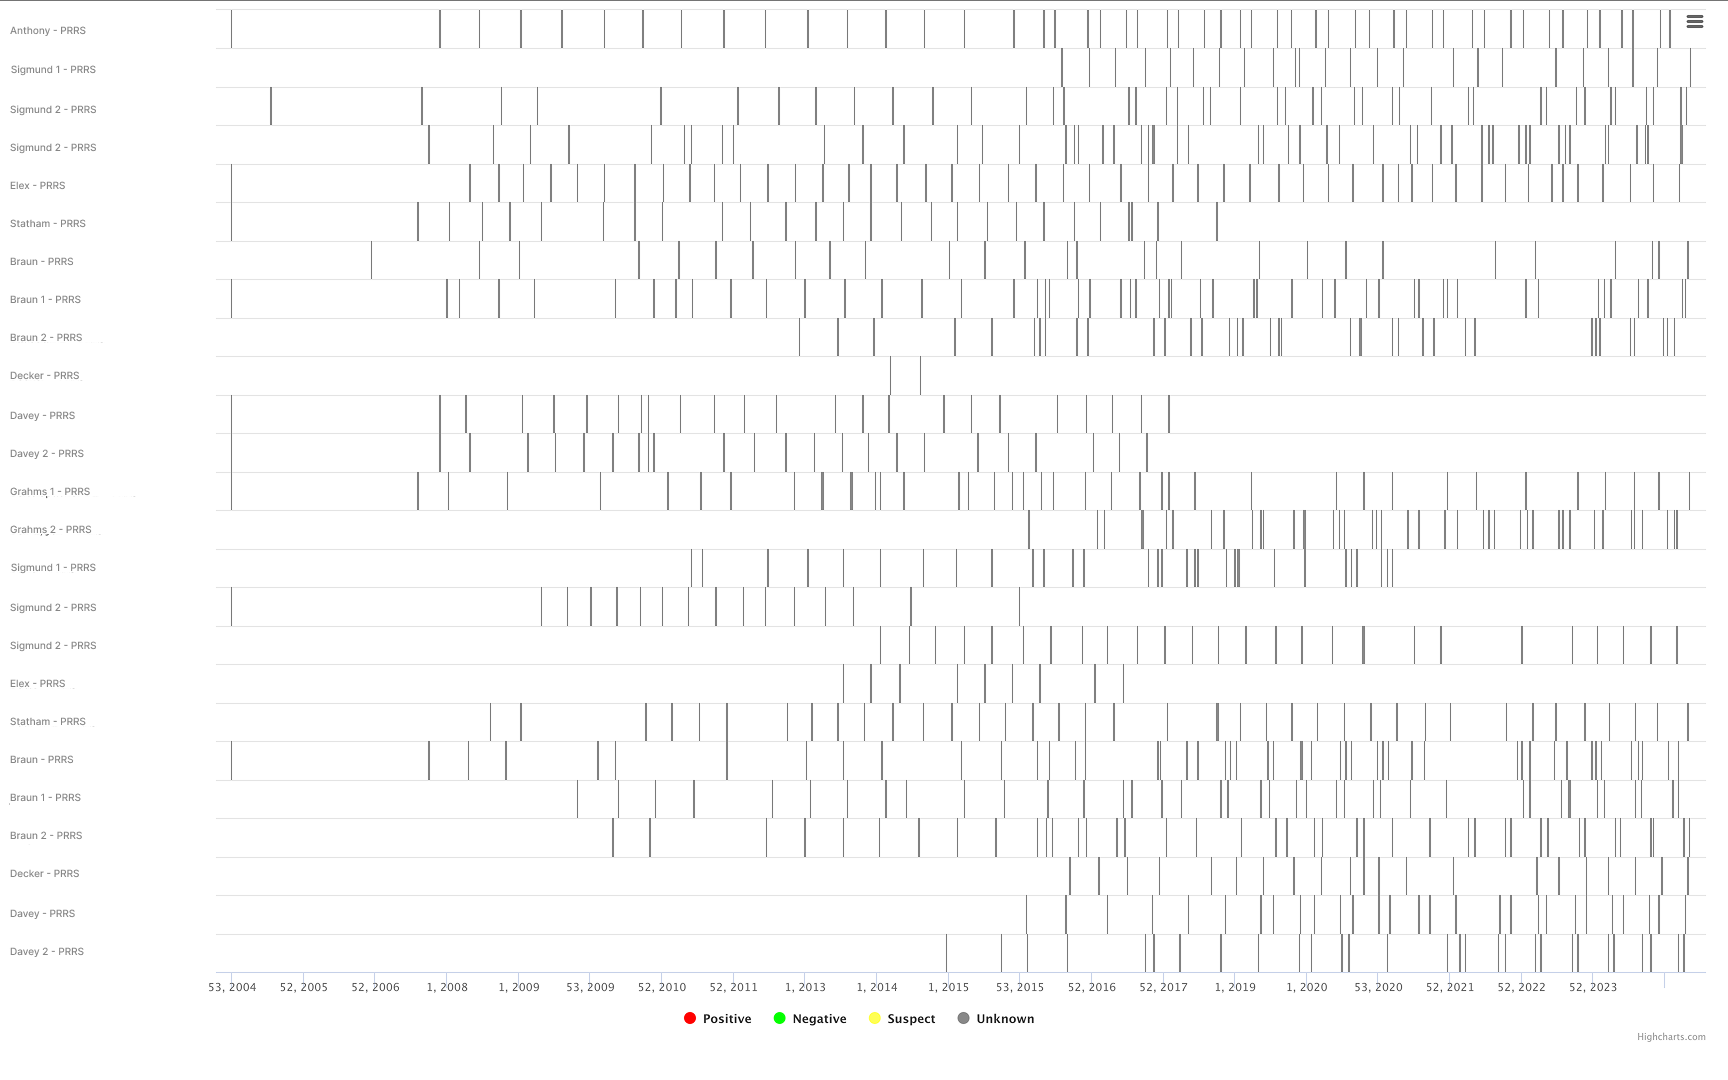
Chart
Evaluate farm-level health status over space and time.
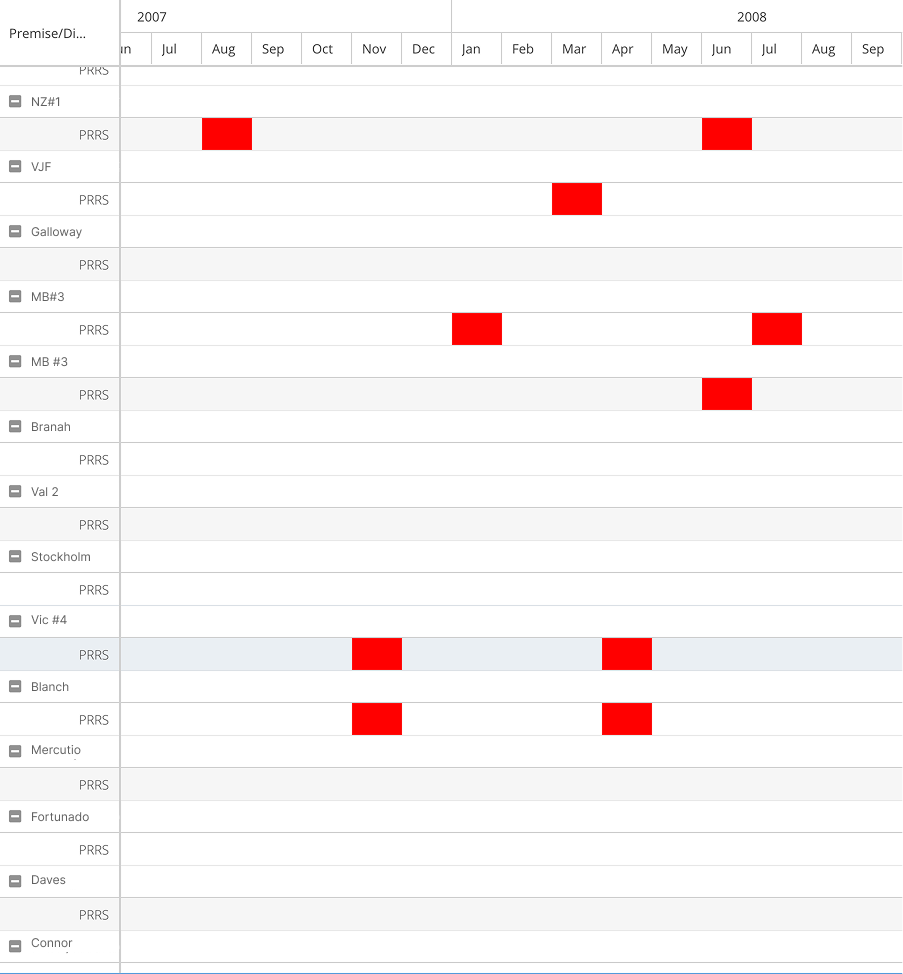
Grid
Quickly identify sites with similar trends.
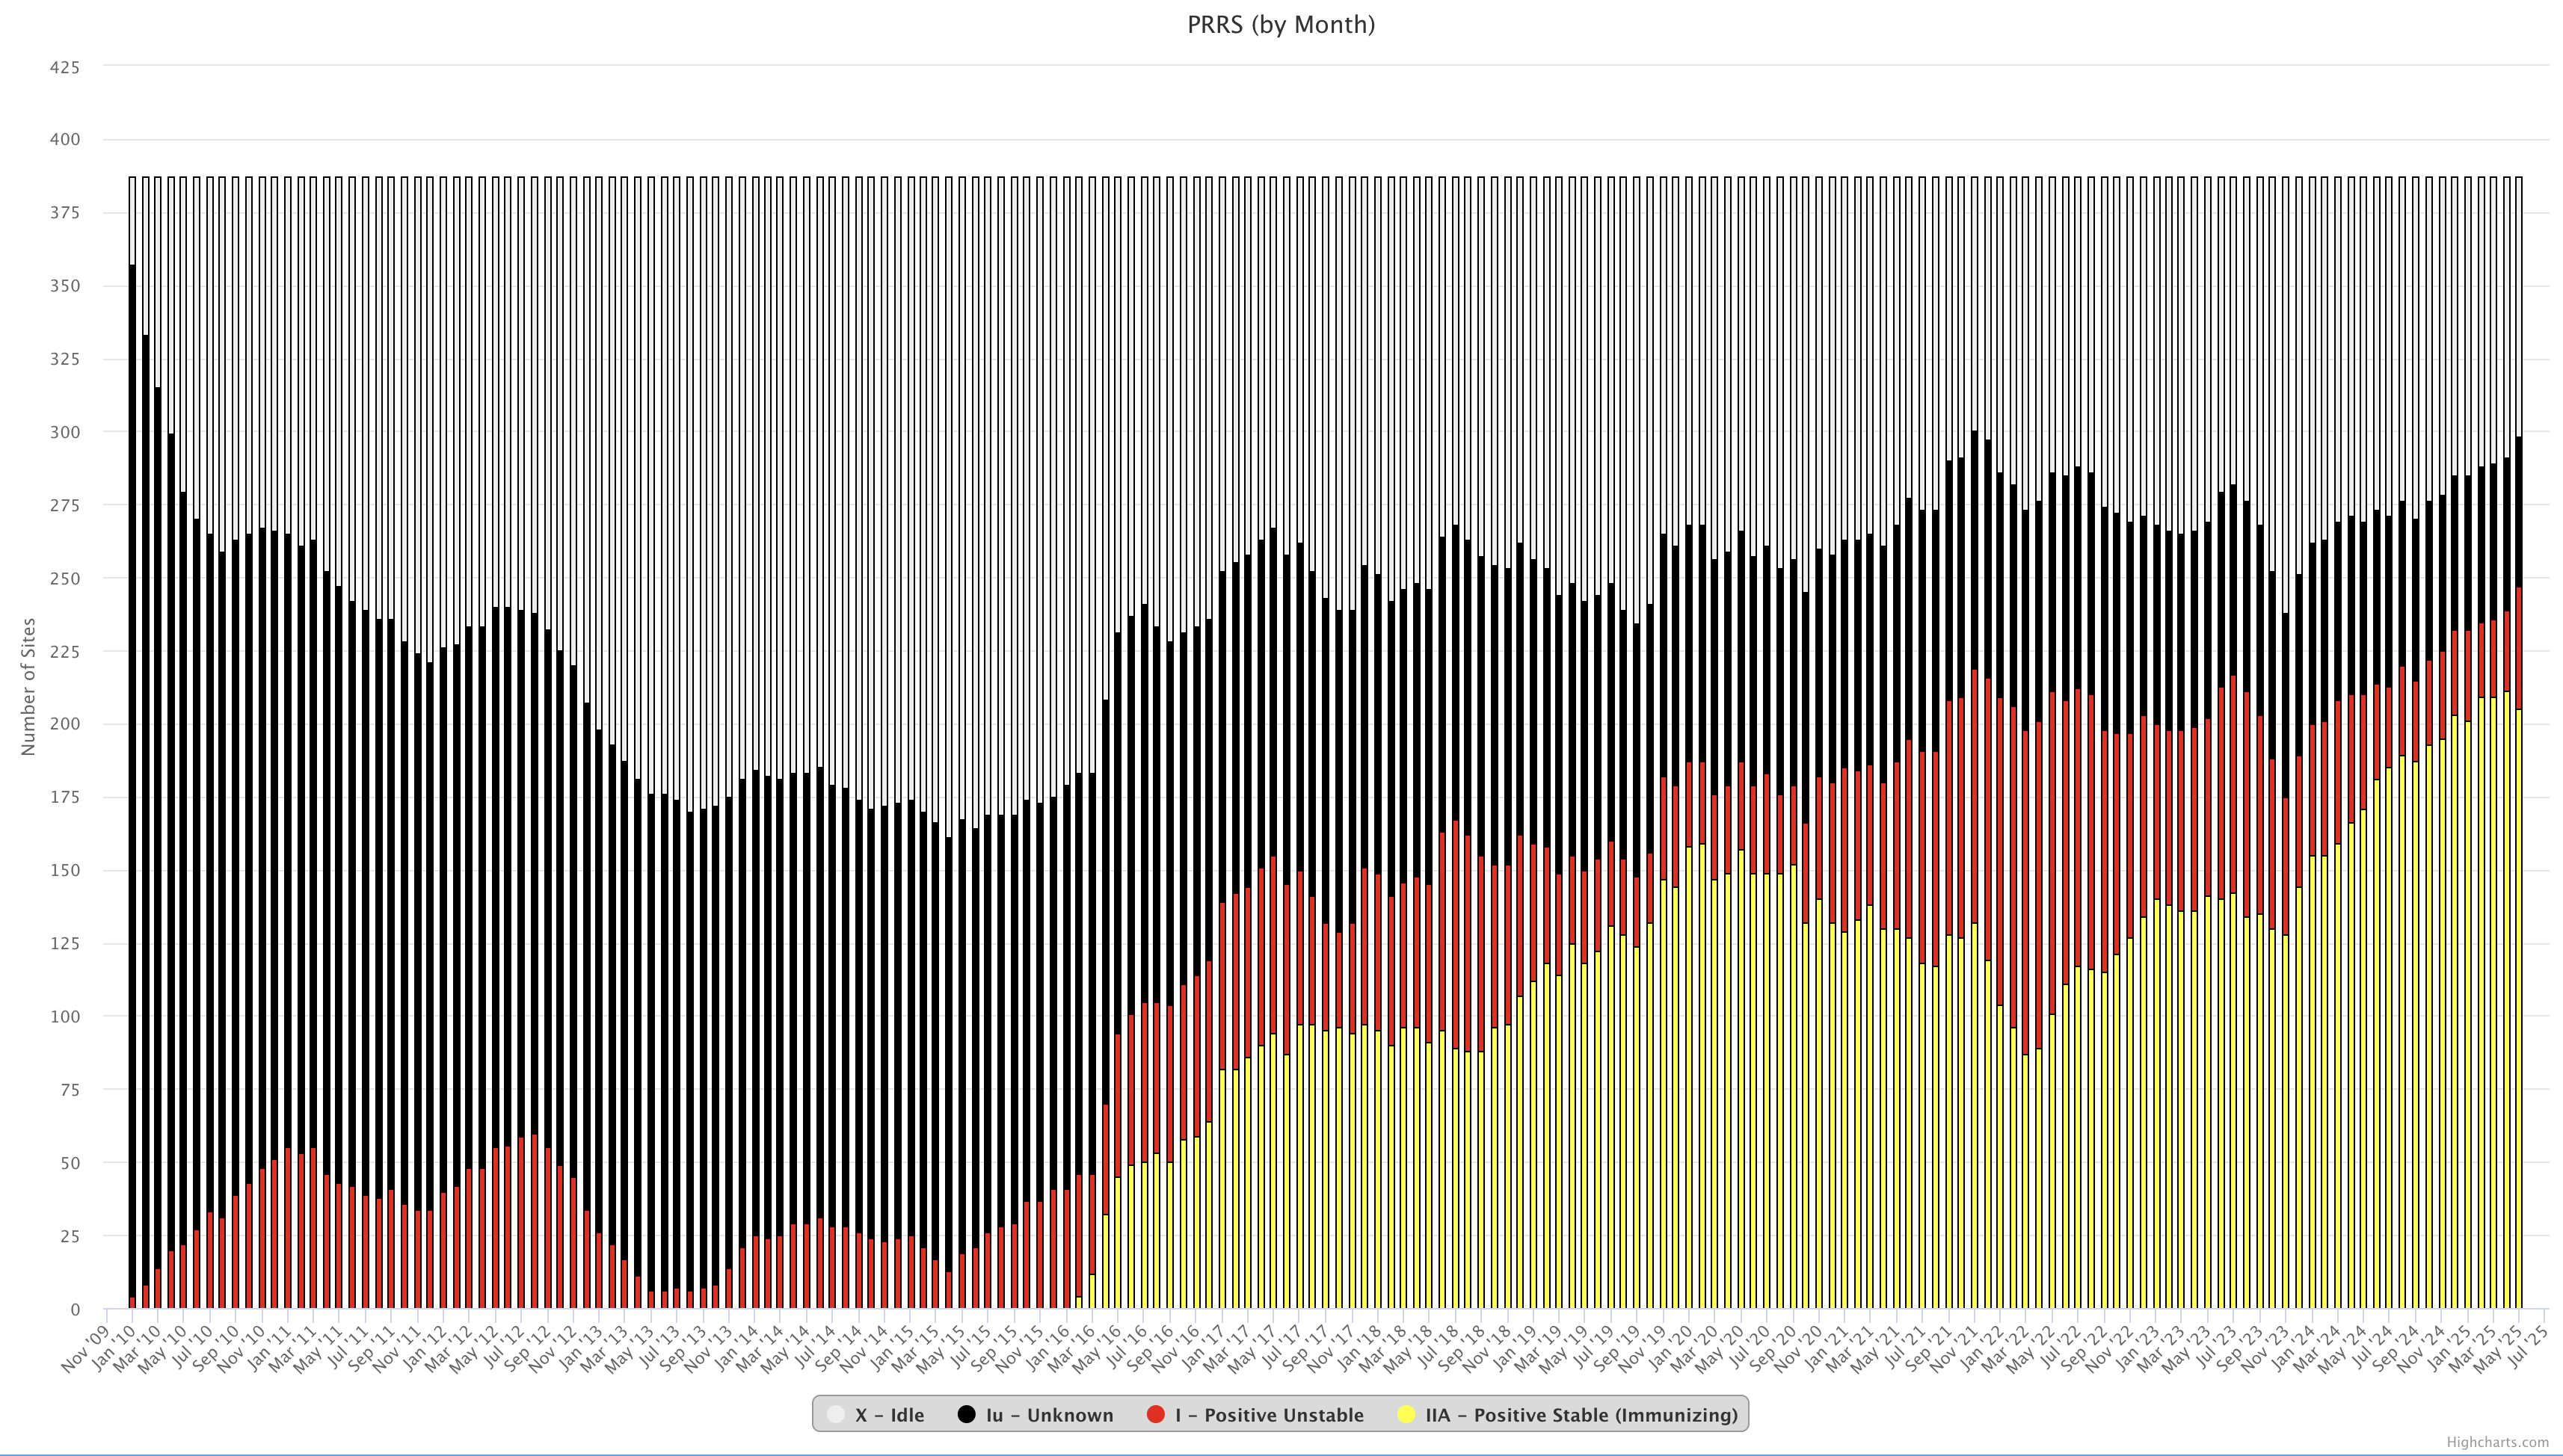
PRRS Classification
Evaluate the success of your PRRS control program.
Map
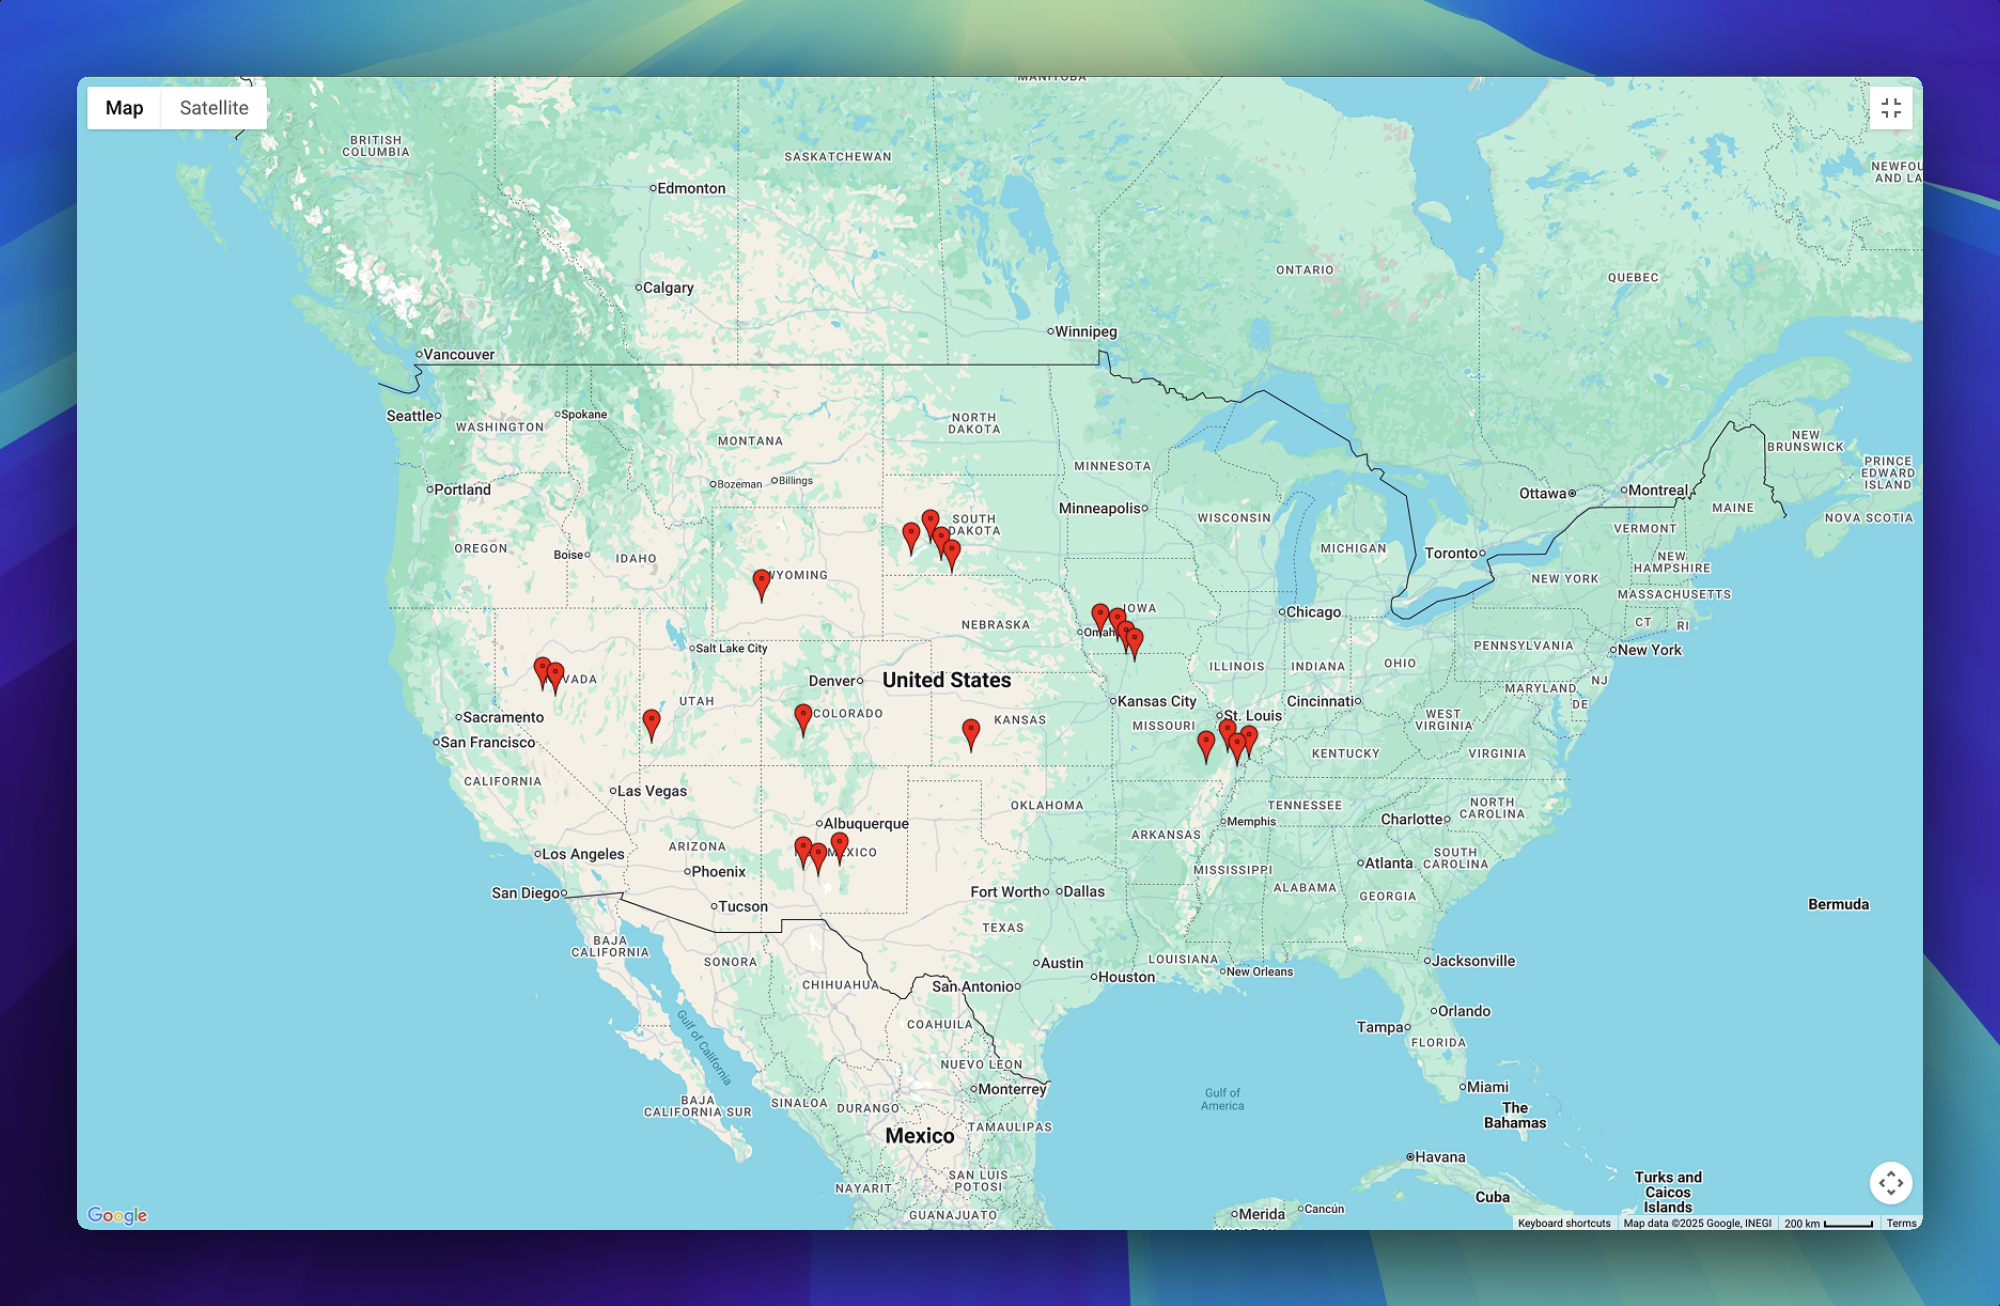
Where it happens
Visualize and group data from farm to county, state, country or continental level.